
Gadget types
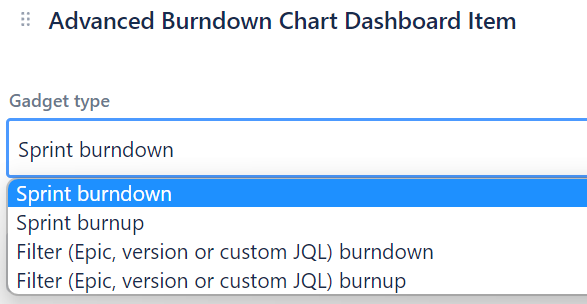
There are 4 types of dashboard gadgets available:
-
Sprint burndown - shows sprint burndown chart. Sprint data is supplied by specifying the JQL filter and might include multiple sprints, you can specify to show each sprint on a separate graph or show a combined graph. Only active sprints are charted; if none of the matching work items is in an active sprint, the gadget says so instead of showing a chart.
-
Sprint burnup - burnup version of the sprint burndown chart.
-
Filter (epic, version, or custom JQL) burndown - shows burndown chart for work items specified by JQL filter. This can be used to display epic, version, or release charts. Any finite collection of work items, that gets resolved when time passes can produce this chart.
-
Filter (epic, version, or custom JQL) burnup - burnup version of the filter burndown chart.
All graphs include total ideal and real graphs in addition to individual (assignee) graphs.
Note, that these reports include finally committed work items and do not show scope changes. Finally committed scope is shown. The app counts work items as completed when the work item resolution (JQL - resolution is not empty ) gets set, regardless of the status of the work item is in.
On Jira Cloud, you can also choose to count work items as done when their status category is "Done" instead of requiring resolution to be set. This is configured via the "Consider work items done when" dropdown in gadget settings.
Estimation types
Supported estimation types:
-
Work item count
-
Story points
Action buttons
The gadget includes the following action buttons:
-
Print - print the gadget
-
Export CSV - export the chart data to a CSV file, with one row per day and one column per line. Ideal lines are filled in for every day, as drawn on the chart. When each sprint is shown on a separate graph, each graph has its own Export CSV button.