Predefined Reports
Simple Custom Reports & Charts app offers ready-made, predefined reports that show useful data to be used without any configuration out of the box. Each set of predefined reports is available to be chosen by opening the appropriate tab. If the app is started from a space menu it will always open up the space tab, while if it is started from a user menu it will open the user tab.
Each tab has reports grouped by Overview and Time Tracking Reports button switches. In the Overview view, the estimation type can also be switched as the app detects all your used estimation metrics (this will not be visible if some estimation types are not used).

These predefined reports are not customizable and in case of the need for a custom layout, please use dashboard gadgets instead.
Space Report
The space report tab will open if the app is started from the space menu, or the tab is chosen manually. The tab label shows the project or board name. Only work items that belong to the current space are included in these reports.
Report sets will differ based on your space type and board type (in the case of the software space). Age reports (Unresolved Work Items and Stale Work Items) are available on the Space tab only for service desk projects.
The overview view includes the following gadgets at the top of the report:
-
Metrics Cards - displays KPI summary cards showing Open, Created This Week, Resolved This Week, and Overdue counts. Each card is clickable and opens the Jira issue navigator filtered by that card's JQL query.
-
Spotlight - highlights the most recently updated open work item in the space, providing a quick glance at the latest activity.
-
Stale Work Items - lists up to 10 least recently updated open work items, helping identify items that may need attention.
User Report
The user report tab will open if the app is started from the user menu, or the tab is chosen manually. The tab label shows the user's display name. Only work items that are assigned to the current user are included in these reports. Personal reports are shown for the currently logged-in user - so each user sees their own stats. The User tab also includes a Time in Status gadget in the overview view.
The user tab metrics cards show My Open, My In Progress, My Resolved This Week, and My Overdue counts, tailored to the current user's assigned work items.
Epics Report
The Epics report set can be opened when the appropriate tab is chosen. All Epics are included in this report and the data is not filtered.
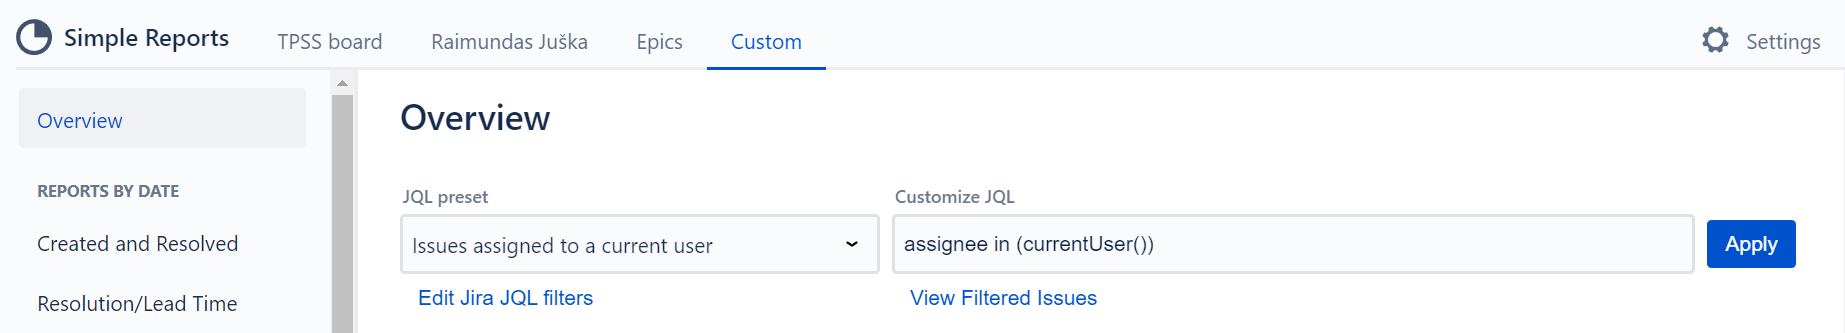
Custom Report
The custom tab allows viewing each type of report that is generated using a JQL filter. The tab provides a JQL preset dropdown with quick selectors for board, space, epic, and version, as well as access to saved Jira JQL filters and a "View Filtered Work Items" link to see matching work items directly. You can also enter a custom JQL query. If you are running Jira Cloud and want to use Adaptavist ScriptRunner JQL functions you should save them and use them as synchronized filters instead via JQL - filter = "enter name or id of the filter"
The Custom tab menu is organized into sections. The following report types are available:
Reports By Date
-
Overview - shows a summary overview report for the filtered data
-
Created and Resolved - shows how many work items were created within the selected timeframe and how many of those were resolved. Note, that the resolved number does not include work items that were created outside this selected timeframe.
-
Resolution/Lead Time - reports how much time has passed between the work item resolved and the work item created times. Note, that this report does not include working hours and counts this time as is. Resolution times are displayed in hours. Times under 1 hour are rounded up to 1 hour — this rounding applies to the average resolution time per time bucket.
Assignees By
-
Created and Resolved - shows created and resolved counts grouped by assignee. Includes chart type switchers: Created/Resolved, Percent Resolved, and Compared to Average.
-
Resolution/Lead Time - shows resolution/lead time grouped by assignee. Includes the same chart type switchers.
Agile Reports
-
Burndown/Burnup - shows burndown or burnup reports. Has 4 sub-types: Sprint Burndown, Sprint Burnup, Filter Burndown, and Filter Burnup, with date pickers for filter-based reports. Read the documentation about dashboard gadgets for more information.
-
Individual Velocity - shows velocity reports. Includes a group-by switcher (Date Interval / Sprint). When using Date Interval, kanban interval options are available. Read the documentation about dashboard gadgets for more information.
Time Tracking Reports
-
Time Tracking Estimation - shows time tracking estimation stats grouped per chosen field. Available grouping options include: Assignee, Reporter, Creator, Worklog Author, Sprint, Epic, Component, Label, Work Item Type, Priority, Status, Version, Team, Space, and Resolution. Read the documentation about dashboard gadgets for more information.
-
Time Tracking Timesheets - shows timesheets grouped per chosen field to track your spent time. Available grouping options include the same as Time Tracking Estimation plus Resolution (17 total). Read the documentation about dashboard gadgets for more information.
Age Reports
-
Unresolved Work Items - lists work items not resolved for a certain time (e.g. 1 week, 2 weeks), grouped by created date. Also lists assignees for those work items.
-
Stale Work Items - lists work items not updated for a certain time, grouped by last updated date. Also lists assignees for those work items.
Work Items By
-
Shows pie charts and reports based on the most used work item fields. More reports can be added by clicking "+ Add/Remove Fields". This can only be done by a user with admin rights. Default fields also depend on a space type - so the service desk space includes more fields, related to SLA.
Created and Resolved and Resolution/Lead Time reports can also be viewed under different time units - day, hour, week, month, the day of the week. Hour reports are based on 24 hours. Week reports are based on the week number from the start of the year.
Work Items By reports also show a pie chart for selected reports, except for key and summary reports. A chart will not be shown if there is a single value in the table or if the number of values exceeds 21.
A graph on a chart can be hidden by clicking the graph label - e.g. to hide resolved work items graph, click the resolved label.
Values that charts are based on are displayed in a table. You can use table search to find the value you require if it is not displayed on the first page. One of the default fields - the summary is included, so if you need to make a report on a certain work item with a known summary, you can select this work item by using the summary field as a filter.
Default fields also include the key report. This report shows work item keys that the reports are based on. Clicking on a key opens up the work item.
Dashboard Gadgets
Most of the reports that are available in predefined sets can be used as dashboard gadgets . Use dashboard functionality in Jira to create a customized report layout.