Heatmap Gadget Configuration
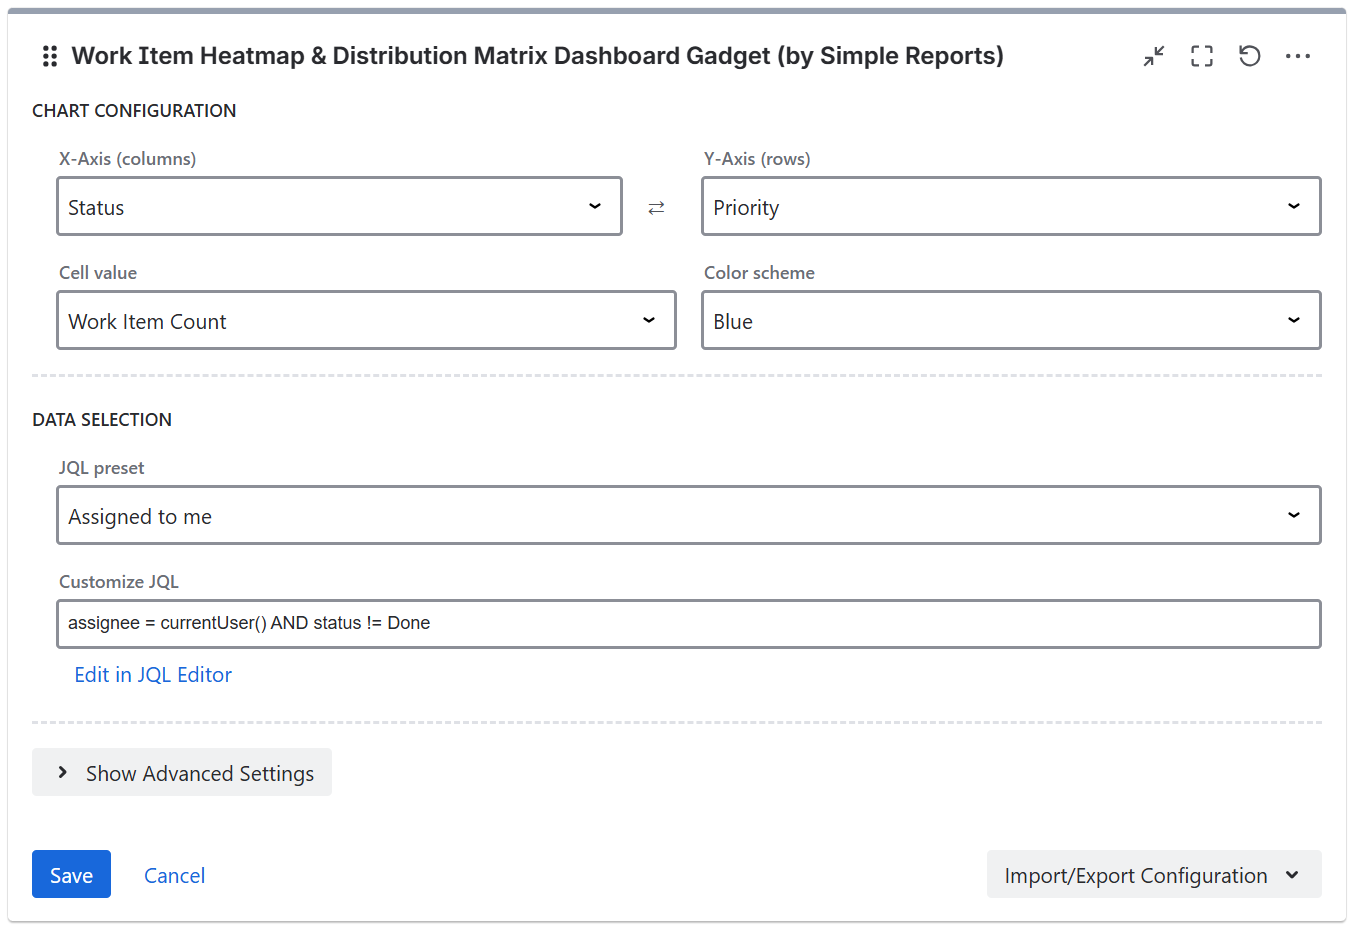
Chart configuration
-
X Axis (columns) - select the field for the column headers
-
Y Axis (rows) - select the field for the row headers
-
Metric - the aggregated value to display in each cell (Work Item Count, Story Points Sum, Original Estimate Sum, Time Logged Sum, Remaining Estimate Sum)
-
Color scheme - the color palette for the heatmap (Blue, Green, Red, Purple, Orange)
An axis swap button is available to quickly flip the X and Y axes.
Display settings
-
Show empty rows/columns - enable to show rows and columns with zero values. Disable to hide them for a more compact view.
Story Points field
The gadget auto-detects the Story Points field. If your Jira instance uses a custom field for story points, you can specify the custom field ID manually.
JQL filter

Data supplied to the app can be filtered using JQL filters, with the gadget supplying some JQL presets.
If you are running Jira Cloud and want to use Adaptavist ScriptRunner JQL functions you should save them and use them as synchronized filters instead via JQL - filter = "enter name or id of the filter"
Import/Export Configuration
Use the Import/Export option in the gadget footer menu to save or restore gadget configuration as a JSON file. This is useful for duplicating gadgets or transferring settings between dashboards.