Available Velocity Gadgets
The app adds functionality to display scrum sprint/kanban velocities on your Jira dashboard.
In addition to being able to track sprint/kanban velocities, gadgets also add the ability to track individual user velocity. In the case of the kanban board, you can specify intervals to show reports for (e.g. 2 weeks) and the start of intervals Kanban reports only show completed values (committed values are not available for kanban boards).
There are 4 types of dashboard items available:
-
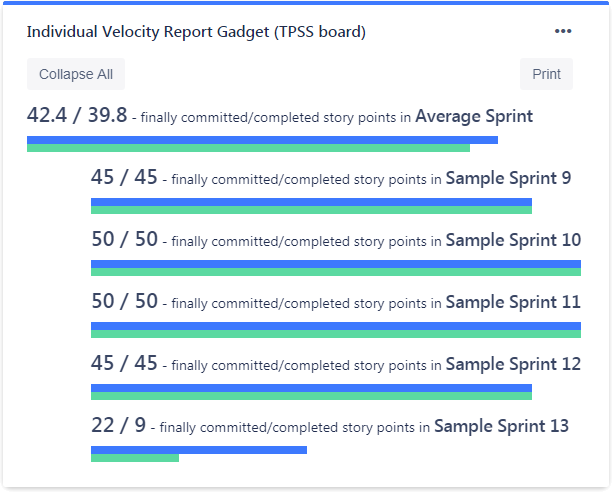
Velocity report (bar chart) - shows the selected number of sprint/interval velocity reports together with sprint/interval average report.
-
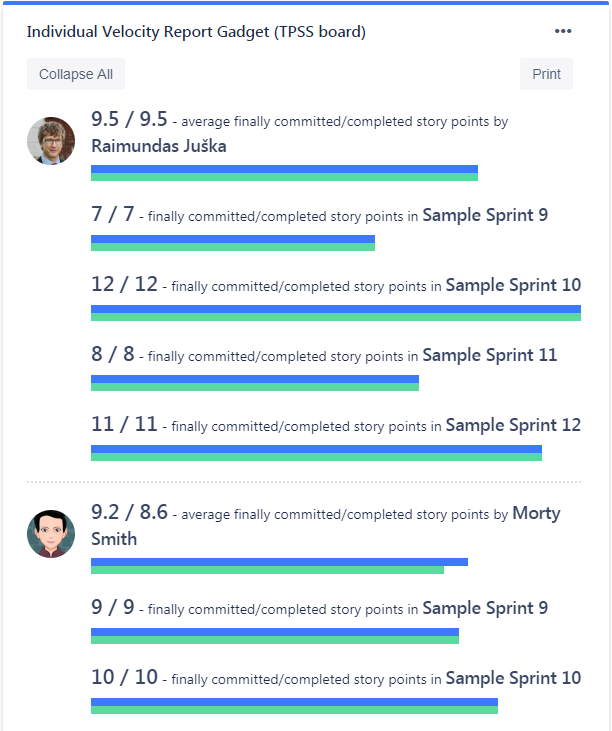
Individual velocity report (bar charts grouped by assignee) - shows velocity reports by the assignee with the ability to expand each assignee report by sprint/interval (assignee on root).
-
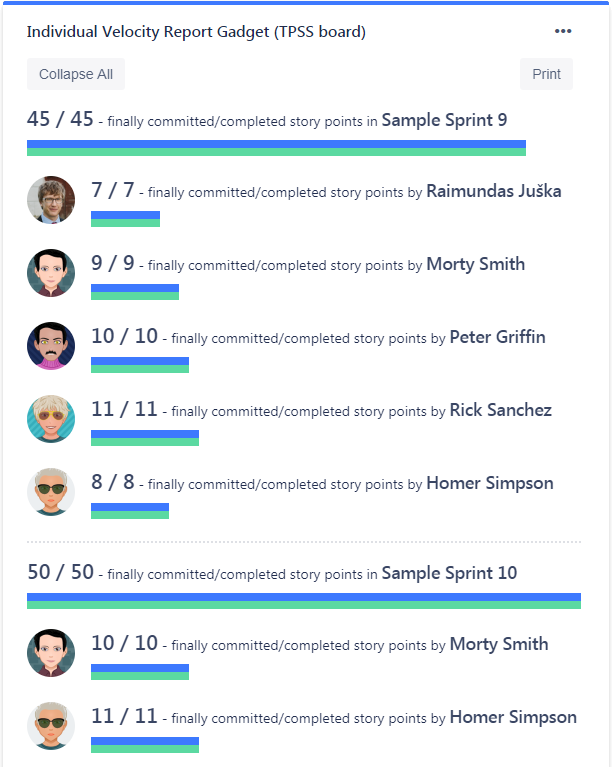
Individual velocity report (bar charts grouped by sprint/interval) - shows velocity reports by sprint/interval with the ability to expand each sprint/interval by assignee (sprint/interval on root).
-
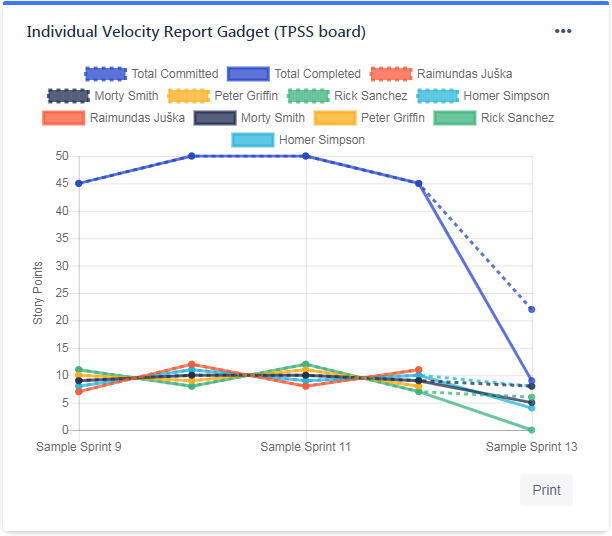
Velocity report (line chart) - shows a line chart with the ability to select which data is shown. So this chart can be configured to show either individual velocity reports or sprint/interval velocity reports.
Note, that these velocity reports include finally committed work items , which differs from the built-in Jira velocity report, which shows initially committed work items. Finally committed work items include work items after mid-sprint removals/additions.
Velocity variance
The gadget displays velocity variance statistics, including standard deviation and percentage, to help assess velocity consistency across sprints or intervals.
Active sprint progress
When an active sprint is included, the gadget shows progress indicators: the current day of the sprint (e.g. "Day 5 of 10"), committed vs expected vs actual work, and whether the team is ahead, behind, or on pace.
Action buttons
The gadget includes the following action buttons:
-
Export CSV - export breakdown data to a CSV file (breakdown gadgets only)
-
Expand/Collapse All - bulk toggle for grouped rows (breakdown gadgets only)
-
Print - print the gadget