Available Heatmap Gadgets
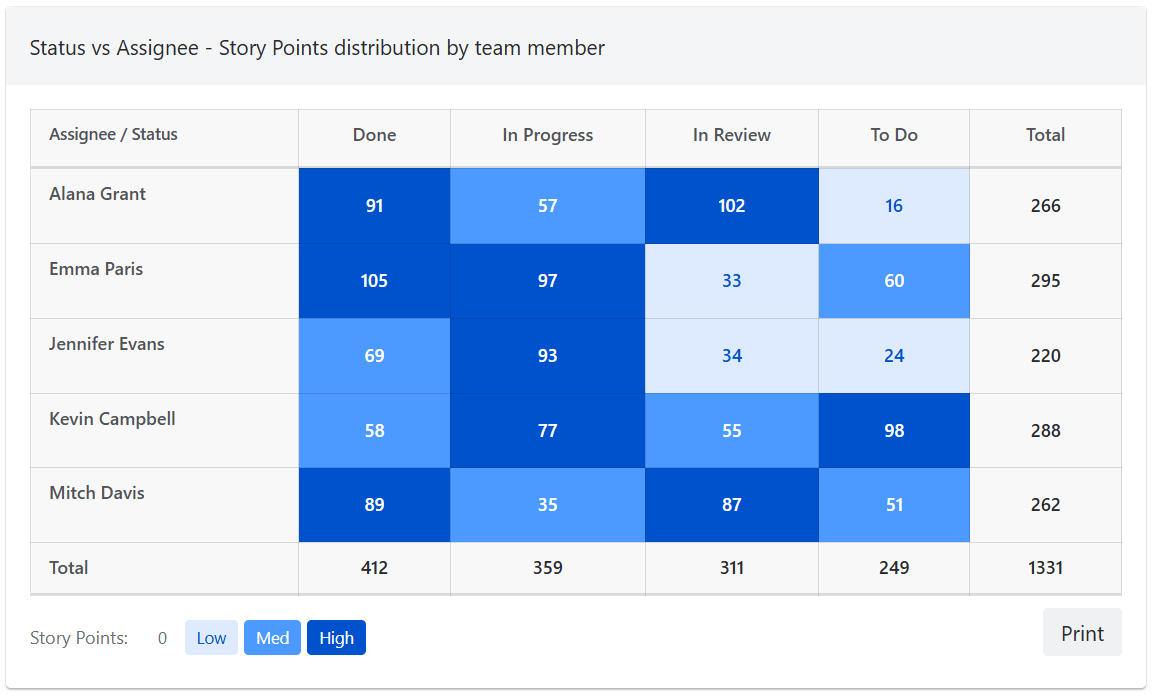
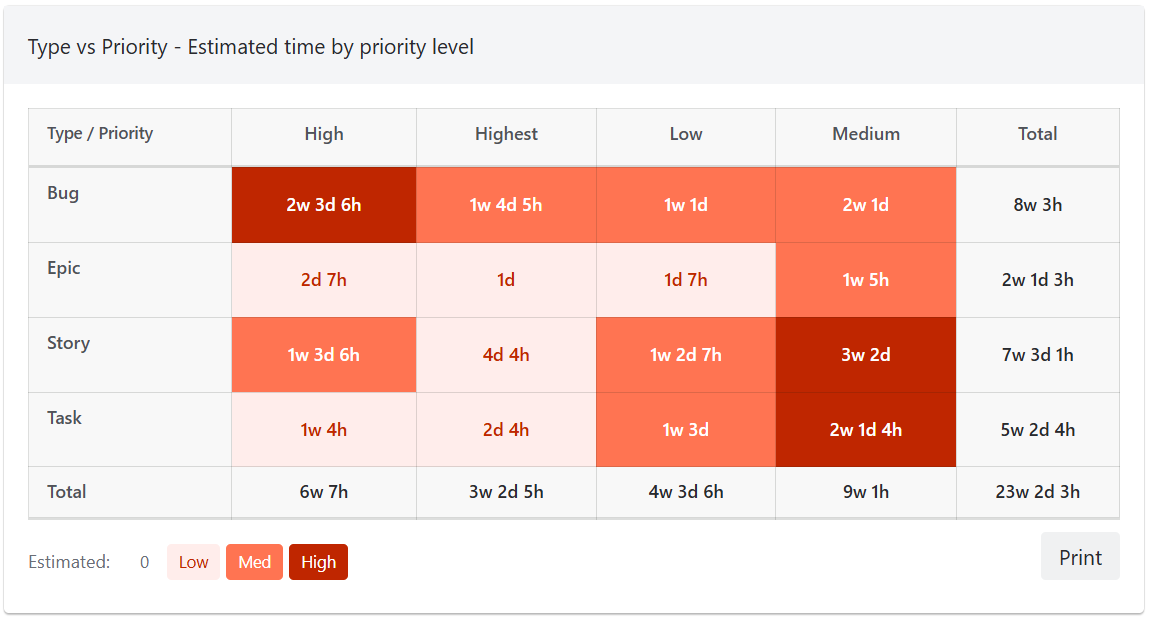
The gadget creates a two-axis table showing the intersection of two dimensions (e.g. Status vs Priority) with aggregated metrics in each cell. Color intensity represents value magnitude.
Axis options
Both the X (column) and Y (row) axes can be set to any of the following fields:
-
Status
-
Priority
-
Work Item Type
-
Sprint
-
Epic
-
Assignee
-
Component
-
Label
-
Version / Release
-
Space (Project)
-
Reporter
-
Creator
-
Resolution
-
Custom fields of option/select type
Metric types
Each cell can display one of the following aggregated values:
-
Work Item Count
-
Story Points Sum
-
Original Estimate Sum
-
Time Logged Sum
-
Remaining Estimate Sum
Color schemes
The heatmap supports the following color palettes: Blue, Green, Red, Purple, and Orange. Color intensity is calculated in 3 levels (low, medium, high) based on the maximum cell value.
Interactivity
Each cell in the heatmap is clickable, linking directly to a filtered Jira issue search for the specific row and column combination. Row and column totals are displayed, along with a grand total.
Action buttons
The gadget includes the following action buttons:
-
Print - print the gadget