Available Estimation Gadgets
The gadget shows work progress as defined by time spent vs time estimated metrics.
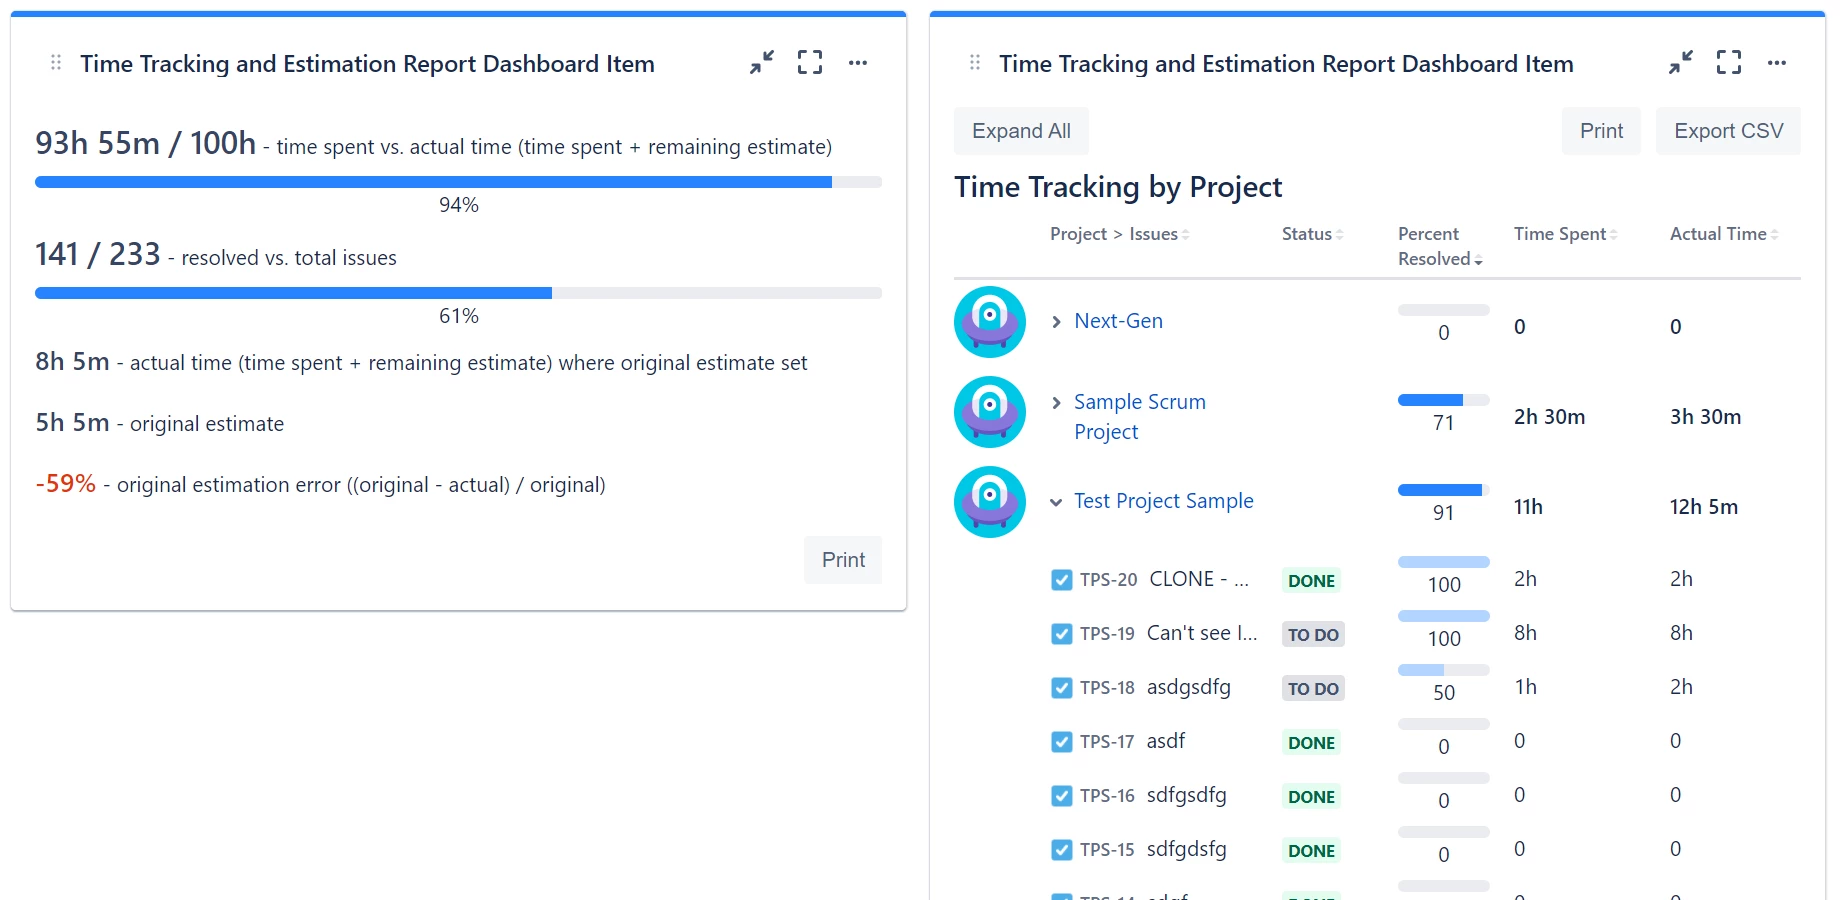
2 main types of gadgets are available:
-
Overview report, which shows a general overview of all aggregate data (left gadget)
-
Data broken down by a certain configurable field (right gadget)
Overview report
The overview dashboard gadget displays the time spent vs. actual time (which is calculated by adding spent time and the remaining estimate).
It also displays how many work items are created and how many are resolved.
Next, you can see the actual time for work items that also have the original time set vs the original estimated time.
This data is also used to calculate the original estimate error, using the following formula - original estimate time minus actual time (for work items that had original time set) divided by original estimate time.
A positive (green) estimation error value means that the original estimate was overestimated and tasks should finish earlier.
A negative (red) estimation error value means that the original estimate was underestimated and tasks will finish later.
If certain data is not set (e.g. original estimate), some fields will not be displayed.
Breakdown gadget
The breakdown gadget displays the same information as the above Overview dashboard gadget, but this information is broken down by selected metric (e.g. assignee, space, sprint, Work Item Key + Summary, or other).
Rows where the grouping field is not set on work items appear as "Not Defined" in the report.
Action buttons
Breakdown gadgets include the following action buttons:
-
Color coding toggle (RAG) - cycle between no color and Red/Amber/Green coloring based on progress thresholds (33% and 66%)
-
Export CSV - export the report data to a CSV file
-
Expand/Collapse All - bulk toggle for grouped rows
-
Print - print the gadget
Column sorting
Click any column header to sort the table data. Click again to reverse the sort direction.
Status category bars
Each row shows a color-coded status bar: green for Done, blue for In Progress, gray for To Do, and white for No Category.