Predefined Reports
Simple Reports & Charts Lite for Jira app offers to test Standard version features once started for the first time by the admin. If you have chosen to trial the Standard version, please refer to the Standard version documentation on additional features.
In the Lite edition, overview report breakdowns (by assignee, space, sprint, etc.) are hidden. These breakdowns are available during the 30-day Standard trial and in the Standard edition.
Simple Reports & Charts Lite for Jira
Simple Reports & Charts Lite for Jira app offers ready-made, predefined reports that show useful data to be used without any configuration out of the box. Each set of predefined reports is available to be chosen by opening the appropriate tab. If the app is started from a space menu it will always open up the space tab, while if it is started from a user menu it will open the user tab.

Current Space Report
The current space report set will open if the app is started from the space menu, or the tab is chosen manually. Only work items that belong to a current space are included in these reports.
Current User Report
The current user report set will open if the app is started from the user menu, or the tab is chosen manually. Only work items that are assigned to a current user are included in these reports. Personal reports are shown for the currently logged user - so each user sees his own stats.
Custom Report
The custom tab allows viewing each type of report that is generated using supplied JQL filter. If you are running Jira Cloud and want to use Adaptavist ScriptRunner JQL functions you should save them and use them as synchronized filters instead via JQL - filter = "enter name or id of the filter"
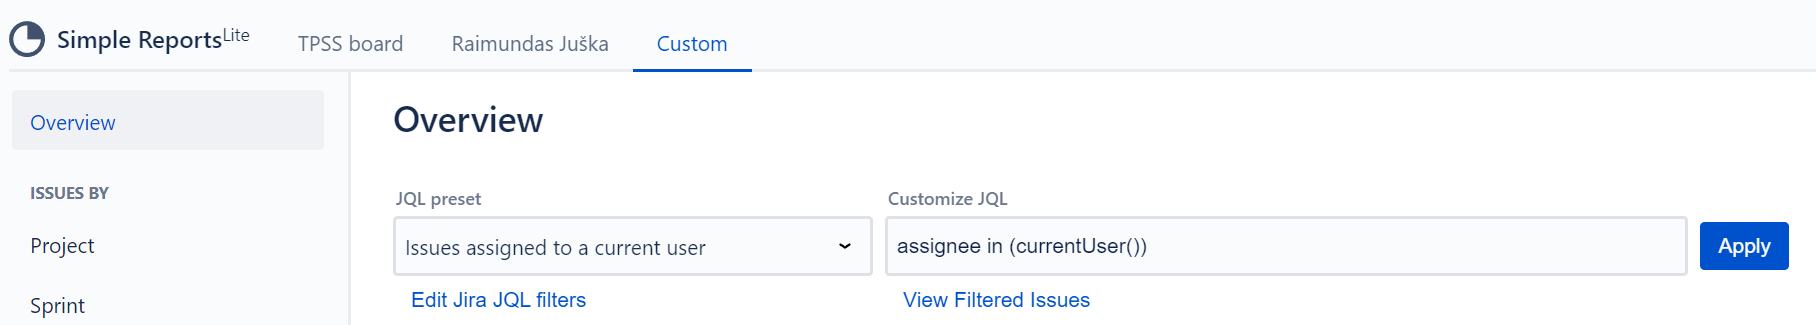
Several types of reports and charts are available on this tab:
-
Overview Report - this report shows the overview status of work items that are included in the JQL filter.
-
Work Items By - shows pie charts and reports based on the most used work item fields. More reports can be added by clicking "+ Add/Remove Fields". This can only be done by a user with admin rights. Default fields also depend on a space type - so the service desk space includes more fields, related to SLA.
Work Items By reports also show a pie chart for selected reports, except for key and summary reports. Also, a chart will not be shown if there is a single value in the table.
A graph on a chart can be hidden by clicking the graph label - e.g. to hide resolved work items graph, click the resolved label.
Values that charts are based on are displayed in a table. You can use table search to find the value you require if it is not displayed on the first page. One of the default fields - the summary is included, so if you need to make a report on a certain work item with a known summary, you can select this work item by using the summary field as a filter.
Default fields also include the key report. This report shows work item keys that the reports are based on. Clicking on a key opens up the work item.